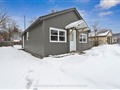
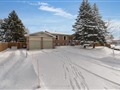
83 Osborn St
$536,036
Comparative Market Analysis
Jun 4, 2025
NOT AN ACTIVE LISTING
Historical Performance
| Period | $ Change | % Change |
| 1 Day | +$188 | +0.035% |
| 7 Days | +$249 | +0.046% |
| 30 Days | -$564 | -0.105% |
| 3 Months | -$948 | -0.177% |
| 6 Months | +$9,522 | +1.81% |
| 1 Year | -$22.4k | -4.01% |
| 3 Years | +$98.7k | +22.6% |
| 5 Years | +$176k | +49.0% |
| 10 Years | +$338k | +171% |
List My Property
Real Estate Statistics
Financing Solutions
Browsing History
36 Mccarthy Cres, Essa
0 second ago
79 Curtis St, Essa
1 second ago
2 Parkside Cres, Essa
1 second ago
72 Osborn St, Essa
1 second ago
85 Curtis St, Essa
2 seconds ago
AS SEEN ON


Are You a Licensed Real Estate Agent or Broker?