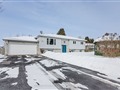
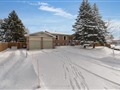
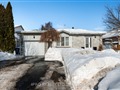
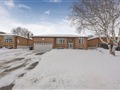
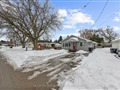
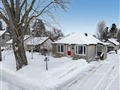
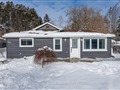
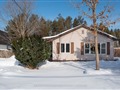
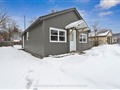
8 John James Dr
$752,021
Comparative Market Analysis
Jun 4, 2025
NOT AN ACTIVE LISTING
Historical Performance
| Period | $ Change | % Change |
| 1 Day | +$264 | +0.035% |
| 7 Days | +$338 | +0.045% |
| 30 Days | -$847 | -0.113% |
| 3 Months | -$1,492 | -0.198% |
| 6 Months | +$13.1k | +1.77% |
| 1 Year | -$31.8k | -4.06% |
| 3 Years | +$139k | +22.7% |
| 5 Years | +$246k | +48.7% |
| 10 Years | +$461k | +158% |
List My Property
Real Estate Statistics
Financing Solutions
AS SEEN ON


Are You a Licensed Real Estate Agent or Broker?