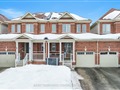
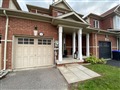
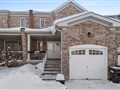
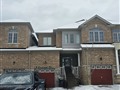
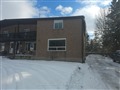
53 Morris Dr
$793,139
Comparative Market Analysis
Jun 4, 2025
NOT AN ACTIVE LISTING
Historical Performance
| Period | $ Change | % Change |
| 1 Day | +$366 | +0.046% |
| 7 Days | +$655 | +0.083% |
| 30 Days | -$1,081 | -0.136% |
| 3 Months | -$3,292 | -0.413% |
| 6 Months | +$10.1k | +1.30% |
| 1 Year | -$40.6k | -4.87% |
| 3 Years | +$119k | +17.6% |
| 5 Years | +$206k | +35.1% |
| 10 Years | +$426k | +116% |
List My Property
Real Estate Statistics
Financing Solutions
Browsing History
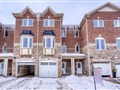
19 Nottawasaga Dr, Essa
0 second ago
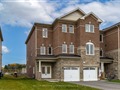
3 Forest Wood Dr, Essa
1 second ago
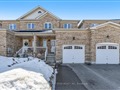
42 Nottawasaga Dr, Essa
1 second ago
AS SEEN ON

Are You a Licensed Real Estate Agent or Broker?