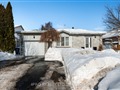
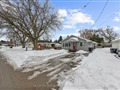
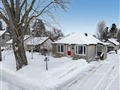
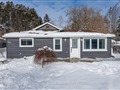
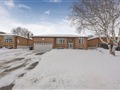
52 Michael St
$732,271
Comparative Market Analysis
Jun 4, 2025
NOT AN ACTIVE LISTING
Historical Performance
| Period | $ Change | % Change |
| 1 Day | +$257 | +0.035% |
| 7 Days | +$346 | +0.047% |
| 30 Days | -$730 | -0.100% |
| 3 Months | -$1,081 | -0.147% |
| 6 Months | +$13.7k | +1.91% |
| 1 Year | -$28.0k | -3.68% |
| 3 Years | +$145k | +24.8% |
| 5 Years | +$237k | +47.8% |
| 10 Years | +$426k | +139% |
List My Property
Real Estate Statistics
Financing Solutions
Browsing History
83 Jonas St, Essa
1 second ago
66 Sixth St, Essa
2 seconds ago
86 Armeda Clow Cres, Essa
2 seconds ago
AS SEEN ON


Are You a Licensed Real Estate Agent or Broker?