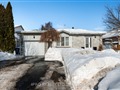
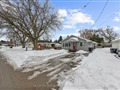
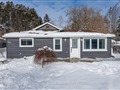
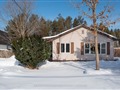
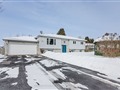
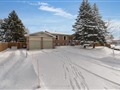
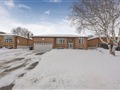
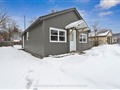
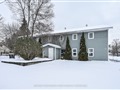
5 John James Dr
$728,506
Comparative Market Analysis
Jun 4, 2025
NOT AN ACTIVE LISTING
Historical Performance
| Period | $ Change | % Change |
| 1 Day | +$256 | +0.035% |
| 7 Days | +$313 | +0.043% |
| 30 Days | -$889 | -0.122% |
| 3 Months | -$1,684 | -0.231% |
| 6 Months | +$12.1k | +1.69% |
| 1 Year | -$32.3k | -4.25% |
| 3 Years | +$128k | +21.4% |
| 5 Years | +$229k | +46.0% |
| 10 Years | +$444k | +156% |
List My Property
Real Estate Statistics
Financing Solutions
AS SEEN ON


Are You a Licensed Real Estate Agent or Broker?