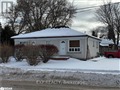
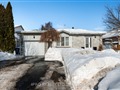
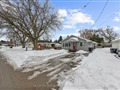
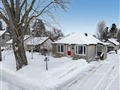
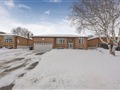
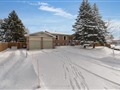
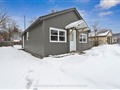
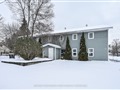
35 Edenbridge Dr
$781,534
Comparative Market Analysis
Jun 4, 2025
NOT AN ACTIVE LISTING
Historical Performance
| Period | $ Change | % Change |
| 1 Day | +$275 | +0.035% |
| 7 Days | +$377 | +0.048% |
| 30 Days | -$747 | -0.096% |
| 3 Months | -$1,071 | -0.137% |
| 6 Months | +$14.7k | +1.92% |
| 1 Year | -$29.9k | -3.68% |
| 3 Years | +$157k | +25.1% |
| 5 Years | +$265k | +51.3% |
| 10 Years | +$422k | +118% |
List My Property
Real Estate Statistics
Financing Solutions
Browsing History
58 Mccann Lane, Essa
1 second ago
39 Larkdale Cres, Essa
1 second ago
39 Coulson Ave, Essa
1 second ago
42 Coulson Ave, Essa
1 second ago
31 River Dr, Essa
1 second ago
AS SEEN ON


Are You a Licensed Real Estate Agent or Broker?