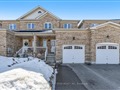
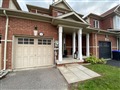
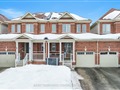
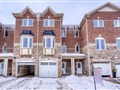
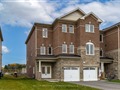
243 Calford St
$450,082
Comparative Market Analysis
Jun 4, 2025
NOT AN ACTIVE LISTING
Historical Performance
| Period | $ Change | % Change |
| 1 Day | +$208 | +0.046% |
| 7 Days | +$372 | +0.083% |
| 30 Days | -$614 | -0.136% |
| 3 Months | -$1,868 | -0.413% |
| 6 Months | +$5,756 | +1.30% |
| 1 Year | -$23.0k | -4.87% |
| 3 Years | +$67.4k | +17.6% |
| 5 Years | +$117k | +35.1% |
| 10 Years | +$242k | +116% |
List My Property
Real Estate Statistics
Financing Solutions
Browsing History
4698 Fifteenth Sdrd, Essa
0 second ago
2 Larkdale Cres, Essa
0 second ago
47 Parkside Cres, Essa
1 second ago
37 Mccann Lane, Essa
1 second ago
11 Ashburton Cres, Essa
1 second ago
78 Parkside Cres, Essa
1 second ago
79 Parkside Cres, Essa
1 second ago
AS SEEN ON

Are You a Licensed Real Estate Agent or Broker?