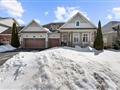
18 Darren Dr
$674,888
Comparative Market Analysis
May 9, 2025
NOT AN ACTIVE LISTING
Historical Performance
| Period | $ Change | % Change |
| 1 Day | +$237 | +0.035% |
| 7 Days | +$367 | +0.054% |
| 30 Days | -$438 | -0.065% |
| 3 Months | -$217 | -0.032% |
| 6 Months | +$14.3k | +2.16% |
| 1 Year | -$21.7k | -3.12% |
| 3 Years | +$149k | +28.4% |
| 5 Years | +$243k | +56.2% |
| 10 Years | +$411k | +155% |
List My Property
Real Estate Statistics
Financing Solutions
AS SEEN ON


Are You a Licensed Real Estate Agent or Broker?