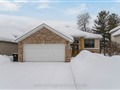
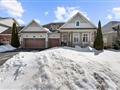
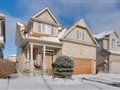
129 Sydenham St
$538,698
Comparative Market Analysis
Jun 28, 2025
NOT AN ACTIVE LISTING
Historical Performance
| Period | $ Change | % Change |
| 1 Day | +$189 | +0.035% |
| 7 Days | +$380 | +0.071% |
| 30 Days | +$74 | +0.014% |
| 3 Months | +$1,153 | +0.215% |
| 6 Months | +$14.0k | +2.67% |
| 1 Year | -$12.0k | -2.17% |
| 3 Years | +$136k | +33.8% |
| 5 Years | +$240k | +80.3% |
| 10 Years | +$379k | +238% |
List My Property
Real Estate Statistics
Financing Solutions
AS SEEN ON


Are You a Licensed Real Estate Agent or Broker?