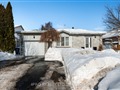
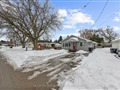
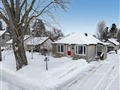
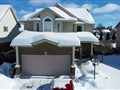
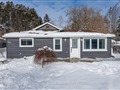
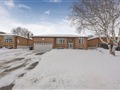
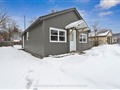
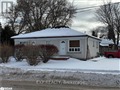
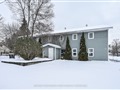
111 Maplewood Dr
$752,144
Comparative Market Analysis
Jun 3, 2025
NOT AN ACTIVE LISTING
Historical Performance
| Period | $ Change | % Change |
| 1 Day | +$264 | +0.035% |
| 7 Days | +$389 | +0.052% |
| 30 Days | -$598 | -0.079% |
| 3 Months | -$684 | -0.091% |
| 6 Months | +$14.8k | +2.00% |
| 1 Year | -$28.0k | -3.59% |
| 3 Years | +$151k | +25.2% |
| 5 Years | +$269k | +55.7% |
| 10 Years | +$474k | +171% |
List My Property
Real Estate Statistics
Financing Solutions
Browsing History
86 Denney Dr, Essa
1 second ago
216 Denney Dr, Essa
2 seconds ago
184 Greenwood Dr, Essa
3 seconds ago
15 Greenwood Dr, Essa
4 seconds ago
10 Greenwood Dr, Essa
5 seconds ago
89 Denney Dr, Essa
6 seconds ago
66 Greenwood Dr, Essa
7 seconds ago
AS SEEN ON


Are You a Licensed Real Estate Agent or Broker?