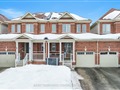
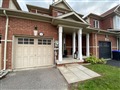
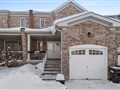
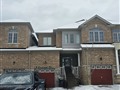
11 Greenwood Dr
$867,322
Comparative Market Analysis
Jun 3, 2025
NOT AN ACTIVE LISTING
Historical Performance
| Period | $ Change | % Change |
| 1 Day | +$400 | +0.046% |
| 7 Days | +$1,258 | +0.145% |
| 30 Days | +$1,546 | +0.179% |
| 3 Months | +$5,877 | +0.682% |
| 6 Months | +$32.5k | +3.90% |
| 1 Year | +$12.4k | +1.45% |
| 3 Years | +$303k | +53.6% |
| 5 Years | +$385k | +80.0% |
| 10 Years | +$568k | +190% |
List My Property
Real Estate Statistics
Financing Solutions
Browsing History
17 Greenwood Dr, Essa
2 seconds ago
38 Greenwood Dr, Essa
3 seconds ago
4 Greenwood Dr, Essa
4 seconds ago
AS SEEN ON

Are You a Licensed Real Estate Agent or Broker?